

Acknowledgment: As always a huge thank you to Bruce Robertson, for inventing virtual list, and for many other contributions to the FM community over the years.
Introduction
As a follow up to my recent “Virtual List on Steroids” presentations at DIG-FM and dotFMP, today I want to take a fresh look at using JSON arrays in conjunction with Virtual List Reporting.

JSON arrays + Virtual List are a natural fit, but, as we shall see, small changes in methodology can make a huge difference in terms of performance, and the approaches we’re going to explore today are the result of a lot of trial and error, and incorporate feedback and suggestions from Dave Graham, Paul Jansen and Perren Smith.
What follows will assume the reader is somewhat familiar with the basic ideas behind Virtual List. If you aren’t familiar, or need a refresher, check out Virtual List Simplified. We’ll get to the demos in just a minute, but first, a review of some of the benefits of using virtual list.
- Flexible framework accommodates complex reporting challenges
- Fast performance
- No need to tamper with schema in your data tables or on the relationships graph
- Unlike traditional FM reports, you can easily combine data from unrelated tables
- Under certain circumstances, virtual list reports (VLRs) can be much faster to develop than traditional FM reports
- 100% multi-user safe and friendly
Overview
Here’s the main idea in a nutshell:


You decide how many dimensions your variable array(s) will have…


…what type of variables to use…


…whether to use PSOS, and if so how much of the heavy lifting will take place server side vs. client side.


Demo Files
- JSON Array VLR, v1 (encodes and decodes a pure 2D JSON array)
- JSON Array VLR, v2 (decodes a pure 2D JSON array)
- JSON Array VLR, v3 (2D hybrid JSON array)
- JSON Array VLR, v4 (1D hybrid JSON array)
- JSON Array VLR, v5 (0D hybrid JSON array)
[Note: If you’re in a hurry and/or are already virtual-list savvy, my current go-to is v4.]
Why so many demo files? Good question. Originally I was going to simply feature v4 and explain why the other methods had been rejected, but I realized that was going to entail a fair amount of assertion without proof. This way, you can test for yourself if you are so inclined.
What The Demos Have In Common
- If the files are hosted, the “locate and parse report data” subscript will run server side via PSOS, otherwise it runs client-side as a normal subscript; either way it returns a 2D array as a script result which is then used by the calling script to render the report
- JSON is employed to construct a 2D array, which (depending on the demo) may be parsed into multiple 1D or 0D arrays as part of the reporting process
- Parsing the array into $$vars enables the user to
- interact with the reports in browse mode, and
- display multiple reports simultaneously
- The $$vars are automatically cleared via an OnLayoutExit trigger when report windows are closed
- You can sort reports by clicking column headings
- You can navigate to underlying sales records by clicking the triangle at the left of a report row
- You can view totals by scrolling the report all the way to the bottom
- Sales data will stay current thanks to a routine that runs at startup (as a consequence, sales data is the same in all five demos through May 2018, but will diverge thereafter).
- After generating a report, you will see a dialog indicating
- number of seconds to encode data
- number of seconds to decode data
- total elapsed seconds
Note that the virtual list reports are scoped to the window name of the report, so if you display the virtual list table by clicking this link…


…you will see gibberish.


Instead click this check box before generating a report…


…to see the virtual list table in action.


Okay, let’s move on to the demos.
Demo 1


This is the “pure JSON” demo. Report data is encoded as a 2-dimensional array by the “locate and parse data” subscript, this array is returned as a script result to the parent reporting script…
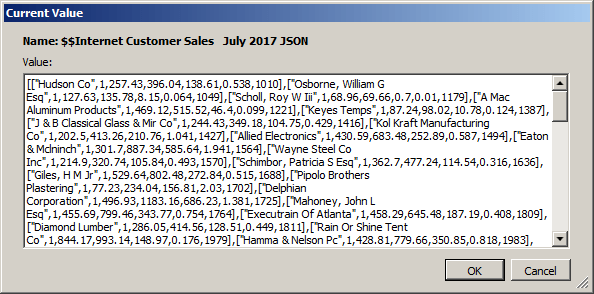

…and then decoded and rendered on a report layout…


…which is based on the virtual list table.


Note that because we’re decoding a 2D JSON array, it makes sense to begin our virtual list table with an ID number of 0 (the same approach is used in v2).
Note also that you are given some choices re: how and whether to use JSONFormatElements during the encoding process. My recommendation is to not use it, as it only slows things down — especially during the encoding phase, but also for decoding as well. At any rate, you are welcome to test and see for yourself.


Demo 2


This demo is similar to v1, except that instead of building a valid 2-dimensional JSON array during the encoding phase, we instead fake it by first creating a list of 1-dimensional JSON arrays, like so…


…and then converting the pseudo-array into a valid JSON array via simple substitution:


Why bother? Because it speeds up the encoding process.
Note that in demos 2-5, you can choose “All” from the month and year drop-downs (if you choose “All” for year, then the month will automatically be set to “All” as well).
Demo 3


Demo 3 uses the same trick as demo 2 for encoding, but instead of converting the pseudo-array into a true 2-dimensional JSON array, we leave it as a 2D pseudo-array, which means our virtual list table can use GetValue rather than JSONGetElement to extract rows (1D JSON arrays) from the pseudo-array, and then use JSONGetElement just on the extracted row.
Since we’re no longer using JSONGetElement to parse the 2D array, our virtual list table can begin with 1 in the ID field — this will hold true for demos 4 and 5 as well.


Benefit: the decoding speed is faster than in demo 2; and scrolling, sorting and revealing the trailing grand summary at the bottom of the report are zippier as well.
Demo 4

In demos 1-3 we’ve been forcing each row in our virtual list table to evaluate a large 2-dimensional array. In demo 4, the “locate and parse report data” subscript will continue to encode and pass a 2D pseudo-array as a script result, but now the parent reporting script will parse that 2D pseudo-array into a bunch of 1D JSON arrays, one per row in the report.


Benefit: once again, the decode time has improved, and again we see a performance improvement in sorting by clicking the report column headings, scrolling, and how quickly the trailing grand summary data renders if you scroll to the very bottom of the report.
Reminder: the reports clean up their own $$vars, so there’s no reason to worry about lots of $$vars per report.
Demo 5

Thus far we’ve seen a performance boost in each demo vs. its predecessors. Since parsing the 2D array into a bunch of 1D arrays was a good idea, what about going a level deeper and parsing each 1D array into multiple 0D arrays so that each report value (a.k.a. “cell”) gets its own $$var, or to be more accurate $$var[rep], like so:


Not surprisingly, the additional parsing means that decoding time takes longer than in demo 4. However, this does not translate into a commensurate performance boost elsewhere; scrolling, sorting, etc., takes about the same amount of time as in demo 4.
Note: in demo 5 we are generating a very large amount of $$var[reps] so you may want to set your Data Viewer to the “Watch” tab as opposed to the “Current” tab before running one of these reports. Or be prepared to wait a long time for the Data Viewer to render all those individual variables.