Editor’s Note: Today I am pleased and honored to present the first in what I hope will become a series of articles by guest author Nick Lightbody of Deskspace Systems Ltd.
Summary: we will describe, discuss and illustrate the statistics that enable you to understand the why and how of FileMaker Server performance and suggest means of delivering a predictable and acceptable performance to your users.
Why this is important
FileMaker Server 13 is a wonderful and very reliable product, provided (as with any product) you recognise, understand and work within its limits.
However, Server is a binary product, in the sense that it either performs “good” or it performs “bad” — very slowly, but very reliably — as it grinds through its backlog until its load has reduced sufficiently for it to catch up on its queued calls and return to “good” mode.
The Deskspace server performance test shown in fig 1 illustrates a common scenario as the number of users increases and suddenly performance declines – dramatically.
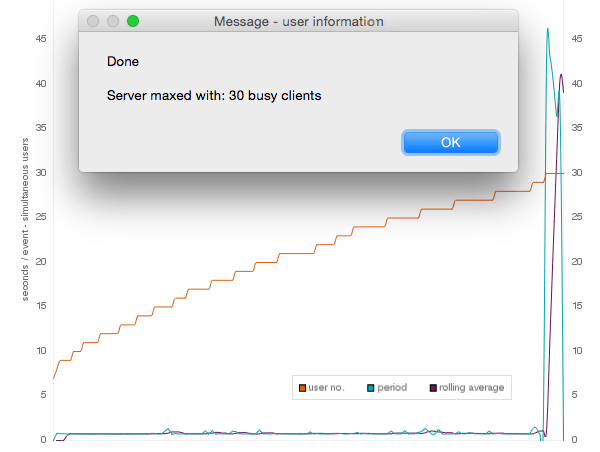
There really is very little middle ground, so when you look at the server statistics and watch the graph crawling along the floor — thinking that you are not really using its full capacity — you may in fact be deluding yourself, as we will illustrate.
An understanding of what server hardware resource is required to ensure that a specific number of users receive a consistently good service is clearly essential but such information is — surprisingly — a little hard to come by.
FMI themselves suggest that Server – if you wish to use FM WebDirect – requires a separate CPU core — effectively a separate CPU — to handle each pair of concurrent remote calls efficiently in a smaller deployment and then gradually fewer cores as the server power and user numbers increase. It is not entirely clear what resource is required if one does not plan to deploy FM Webdirect.

That is a great deal of horse-power – but we should note that FMI have reduced their recommended cores per user to about half of what they advised just a few months ago.
And that’s a “remote call”, not a “remote user”. Depending on the complexity of what it is being asked to do, Server can handle quite a few calls a second, so it would be interesting to work out how many… and perhaps to relate the number of remote calls to calls per user?
Whilst FMI’s own technical recommendations are a good starting point they can appear more than a little conservative when compared with many people’s own experience — where often 4 cores appear to support 20 or more users. So what is going on?
Research
To investigate this we are using a method of testing FileMaker Server with “virtual clients” — server side scripts whose completion we do not await. Hence we can send off a series of autonomous scripts (each simulating a client using server) from a single client side UI, watch the CPU history and statistics in Server Admin Console, watch the event log recording the statistics for each transaction, and load up the Server to the point of near choking by adding or disconnecting virtual clients.
These current comments apply only to FMP or FMGo connections, and not yet to WebDirect which we will test on another occasion.
Using admin console statistics
The true load factor on FileMaker Server itself – ignoring for these purposes the load caused by slow networks and slow data storage i/o – is not the number of FileMaker clients but the number and frequency of remote calls, one of the 11 statistics observable in the FileMaker Server Admin Console under Statistics. For our investigation we need to turn on the following statistics — but remember that these numbers are each a sample of a single moment in Server’s operation (at the time the sample is taken), so turn the sample frequency in Admin Console up to every 3 seconds to get a better idea of what is happening, then turn it down again when not required since measuring anything also affects what you are measuring — in this case by creating load, so a higher frequency will slow down normal operation.
(1) Remote calls/sec – this represents the server load – each call being a significant set of instructions
(2) Remote calls in Progress – at any single moment – when the sample is taken – often zero
(3) Wait time (ms)/call – this shows the effect of load – the output – delivering the user experience
The point at which performance and hence user experience starts suffering is indicated by spikes in the Wait time (yellow) but is determined by the Remote Calls in Progress (pale blue) moving above the floor of the display and remaining there.
Choking on “busy” users
A typical situation is shown in fig 3, where “Busy” virtual users are being added rapidly to a 4 core core MacMini host. There is a small spike at 14:14, but after additional users arrive to bring the total to 15 at 14:15. At 14:16 the Remote Calls in Progress lifts off the floor and stays up with values of 12 – 18. The server has insufficient speed to recover until the load is significantly reduced, hence the queue is congested, server chokes, everything slows and nearly stops.
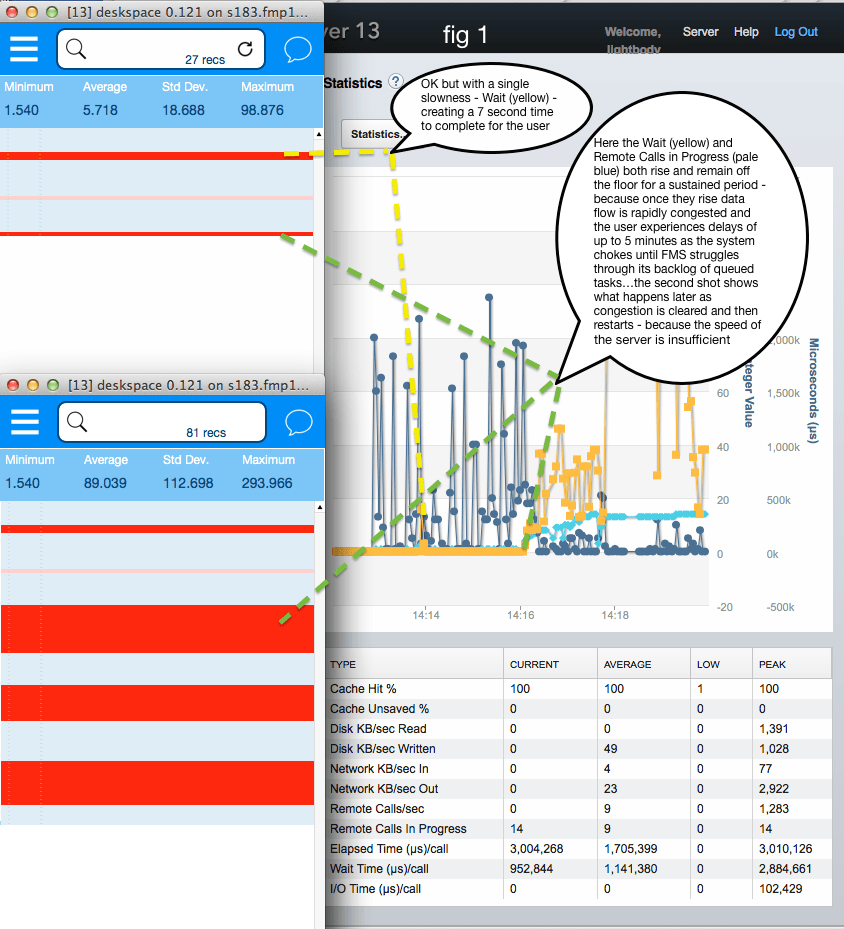
Choking is simply that: the rate of new calls on server exceeding its ability to deal — hence an ever increasing queue builds up which takes time to be dealt with by the Server and then, eventually, cleared.
This choking characteristic is why folk may be misinforming themselves when they look at the stats and think their server has much more spare capacity available than is in fact the case. The moment Remote Calls in Progress exceeds the number of cores available in the CPU, the risk of a suddenly escalating choke arises. The choke develops very rapidly — each delay multiplying further delays behind it — so the apparent surplus capacity disappears in an instance.
Supporting more less active users
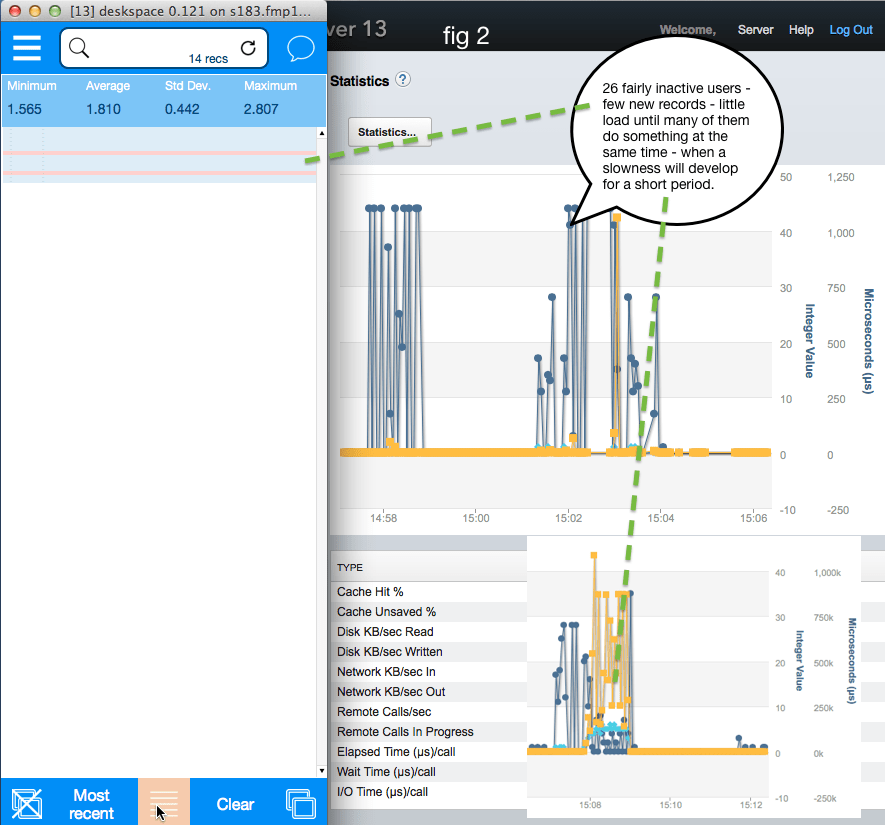
However, if users with a lower level of activity are introduced, in this case “Fairly Inactive users”, server will support a much higher number, as shown in fig 4. Until that is many of them do something load creating at the same time, in which case congestion and a choke will arise but likely be short lived, because since the general load is low there is little load bearing on top of the congestion to escalate the choke.
Observations
We can observe from fig 3 that a level of below 50 Remote Calls / sec (dark blue) seems sustainable for this server, but that when the level moves above 50 the server moves beyond its ability to clear the backlog without significant delay. However, there must be more to it than that since in fig 4 at 15:08 Server suffers a minor congestion with Remote Call / sec below 30.
As the server has 4 cores we can make an initial theory that each core can safely handle 10 – 13 calls a second, but that when that capacity is exceeded choking will result. This clearly requires refinement based on the inconsistency in the preceding paragraph.
Getting the best out of FileMaker Server
The foundation of the performance we are observing is the speed and capacity of the server hardware (virtual or real) hosting FileMaker Server, the number of CPU cores, their speed in GHz, the amount of RAM in Gb, the amount of FMS cache you have selected in the FMS Admin Console, the efficiency of the operating system, the efficiency with which Filemaker Server itself deals with its work and uses the 64 bit architecture it has available and, finally, how well written is the solution/app you are running.
In order to get the best out of our deployment we can consider the following options:
A. ensure that we have a good idea of the load that will be created by our intended user cohort — perhaps split them into less active and busy users and estimate that two less active users are roughly equivalent to one busy user;
B. plan to support no more than say 4 busy users — or equivalent less active users — per CPU core with something like a mid range MacMini, provided you fit as much RAM as it will take, which is currently 8 or 16 Gb depending on the age of the machine;
C. provided our solution is well written and efficient consider using cloud based hosting on virtual machines so that server resources can easily be increased if required to cope with increased demand;
D. ensure that we are using the most up-to-date version of FileMaker Server available as this software becomes faster with every new version that is released;
E. consider writing a token controlled flow-control system to regulate the load that your solution/app applies to FileMaker Server. This is like trains travelling in opposite directions on a single line: a “train” (a load creating instruction to server) is only permitted to use the line when it has obtained a token. By restricting the supply of tokens we can control the number of calls being heaped upon Server, to protect it from being over burdened. This is what we have done and fig 5 illustrates the detailed performance we obtained when testing several WAN servers recently, including with token flow-control turned on and off.

We assess deployments using a Productivity Index for the systems capacity (larger is better) and a User Experience Index (smaller is better) to predict the goodness — or otherwise — of the user experience. When we turned token flow-control off you can see (in the red boxes) that the Productivity declined from 51 to 45 and the User Experience declined from 25 to 410;
F. consider improving the efficiency of our solution/app — the less we ask FileMaker Server to do the more it will get done and solutions which were written or started many years ago will certainly be capable of being much improved with a more modern approach to designing and building. Things that took hundreds of steps a few years ago can now be done in very few with a commensurate reduction in server load. We need to simplify our solution and play to FileMaker strengths. Consider removing all features that are really not required by most users. It can be surprising at how much you can improve performance by just removing unnecessary scripting; relationships and layout objects;
G. we must of course use styles and themes well — bite the bullet and get rid of classic if we have delayed.
Nick Lightbody
17 December 2014
A career in international sailboat racing, followed by 15 years in the legal profession, before founding Deskspace Limited at the beginning of the new millennium, informs Nick’s approach to the conception, creation and iterative development of better products. He built his first FileMaker solution in early 1998. Since January 2011 he has been dedicated to developing a more efficient method of deploying FileMaker based Apps over the web — this has led since April 2012 to a focus on simplicity, reduced feature sets and speed.
Nick ( and thanks to Kevin ) – what a wonderful analysis of server performance and the design implications of the user UI. Will be much food for thought in next project – and reconsideration of implementation in existing projects. It is such a gift to the community when someone who “gets it” is willing to share to those of us who “bump up against it”.
Stephen – I am delighted you found this useful.
Cheers, Nick
What have you found regarding hard disk speed?
Generally 90% of slowness I have experienced has been poorly considered design and development. Because FileMaker makes it so easy to throw some code, calcs and summaries at a problem often this causes builds slow code on top of slow code. I know we have discussed this before but I really like tall thin tables, avoiding unstored calcs on tables with a lot of records. In the past I have written stock systems that calculate on hand stock by adding the inns and outs but while this works fine on small solutions its a bad idea down the line. I have done a little work on combining tall thing tables with some tricks to avoid record locking in scripts. If you say hello at the next tech net I will show you what I am doing.
A little nugget I picked up somewhere was entering find mode before navigating anywhere. No point in showing users the first x records of a million when they enter a layout.
Perform script on server has been touted as a panacea for all performance issues but this is a two edged sword. Because the server can generally handle a lot more heavy lifting than, say 50 iPads, when it hits a cliff it really gets hammered.
Have you experimented with SQL? While a SELECT is generally no quicker than a goto layout and find, I have found using UPDATE …. WHERE is often quicker than a goto layout, find, replace (assuming you can use plugins or use execute on server for iPads). SQL use also allows a reduction in the complexity of the relationship graph and while that has little impact on overall performance opening the file is quicker. I am trying to avoid having all those funny little one use relationships in the relationship graph and keep it as close to a traditional ER diagram as possible.
Hi Damian
I agree with all your observations on performance – I am working on another piece on Single Table Architecture – the current App I used for this test program has a single main user data table with a single field for all textual data – this seems to work quite well on mobile devices and has the benefit of great flexibility i.e. the simpler the structure the more widely it can be applied.
I plan to make the test file I have been using freely available next year – this would mean that anyone could could run it and obtain compatible results. For me finding a good basis for comparison was key – to be able to establish whether one form of deployment seems faster or slower – was more or less able to support users than another. The test file could automatically upload its data to a common server and then users could compare their results.
By using a consistent method of testing you could answer your question about hard disk speed. Logically it must be good to have faster media – a consistent test which pushes the server to choking should provide clear answers – as opposed to inspired guesswork.
I used to use the Enter Find Mode before changing layout but don’t do so now.
I have found a method I call Legion Control which simply and quickly enables users to have access to a limited number of recent records when they enter a layout and then extend how far back they want to go with appropriate warnings about the time it may take. This is working well on an iPhone with 100k records in the data table.
I have used ExecuteSQL() a little. I tried it to speed up the Performance Dashboard for this testing as the testing creates many records. Since it has to effectively walk the entire table it is not fast with big data sets but it is predictable. Like you I found that removing some relationships and extracting data with ExecuteSQL() was a better method.
For user experience – for me – the Ui should respond immediately – the user can decide to undertake an operation for which they have to wait – but it must be their decision – i.e. they should never have to wait after navigating to another screen.
Thanks for your comments Damien
Cheers, Nick
Hi Nick,
For me, I don’t use web direct, Filemaker can’t use cores efficiently, I’ve seen it use 2 core max (200% CPU usage). So, when doing you test, does activity monitor reports near 400% CPU usage or not. I guess it doesn’t, so if it’s more like 100-200% like I’m seeing in production, maybe that means it can’t use more than 2 cores. So, it’d be cool if you redid your test with CPU cores disabled to two (Xcode other tools allow you to disable cores).
Thanks
Hi Vincent,
That is a very interesting comment / observation.
I don’t know whether or not you are correct though? FMI recommend multiple cores as you know which suggests that they can use that additional resources. However – my research to date has not shown a marked improvement in performance with more than 2 cores – at least not to the extent I would have expected – so you may have a good point?
The only way to test this is to do as you suggest and run the same test on a 4 or 6 core machine then re-run with some cores turned off – I will have a look at this in the New Year – thank you for your contribution to this discussion Vincent,
Cheers, Nick
Hi Nick,
FMI only really talked about cores for web direct.
FMS only use 7 process, but only 2 really matters in our case
fmserverd : main process
fmsased : server side script engine
fmsib : this one is for backups I think.
other are listener, and webstuff which I don’t use.
12 introduced fmsib for backups, so it’s a tad better than before because now backups are not using the main process.
I’ve never seen fmsased using more than 100%, I think I may have seen 150/200% for fmserverd (but I don’t remember, I think it may have been in 11 days with a backup going on).
Of course, as fmserverd is serving data, fmsased is constrained by it, and often you’ll see
fmserverd 40%, and fmsased 60% : totalling 100%
When 12 arrived, I created a script doing a loop with variables (so that’s a 100% processing stuff, no data serving). I ran 4 server side instance of it on my 12 cores mac, fmased only used …100% rather than 400%
So to me, FMS (not using web direct) is clearly not “core aware”
Hi Vincent – thank you again – your observations are very interesting – I look forward to taking this into account in further testing next year.
Cheers, Nick
When we did load testing prior to a 20 or so user deployment of WebDirect, we found that WD definitely uses multiple cores. As more and more concurrent users logged in, the cores came to life. They appear to be utilized as other cores maxed out.This was true for both single and two machine deployments. We further load balanced the two machine deployment by having some of the scripts run on server (they appear to also to use all cores as needed), there by spreading out processing across as many cores as possible on both machines.
Hi Vince
Sorry to be so slow – have been away for a couple of weeks – very interested to hear your observations – thank you for sharing them – can you remember what sort of deployment was this, Platform, OSv, FMSv etc?
Cheers, Nick
Yes Web Direct uses cores, that’s why I wrote that my observations were not using Web direct.
To me the database engine, the things that are uses in FM Clients to Server, are not core aware.
In my opinion, the core used by WD are just used to render WD, they are “wasted” dealing with humongous WD overhead (the fact that WD is said to need 12 cores for dealing with 50 client, is just a testimony on the insane CPU consumption of WD)
Nick
We tested WD on Mac OSX 10.9 machines 8 core i7’s with 16G of Ram. WD will use 4 cores until they are starting to max out, then moves to the other set of 4 cores (at least during our tests). We started the deployment in v2 and are now running with v5. Each WD session as well as server side scripts (Both scheduled and initiated via “Perform of Server”) appear to be virtual clients running in their own space, hence their multi-core awareness, similar to the cpu load of a Citrix server. Of course I am merely inferring this from observation, not from any inside knowledge of WD’s true underpinnings.
Thanks Vince for your further insight – I hope to be able to investigate and report on the use of cores in a future article
Cheers, nick
Hi Nick,
We have recently upgraded from FMS11 to FMS13 on a large system with 170 FMP clients, some of which logging in from WAN locations. 25% of our users can be considered “busy”We are experiencing 1 to 5 minute CPU max outs(Windows Server 2008 R2 Resource Monitor indicates fmserver using 15-25% CPU) every 10 minutes or so. I tried increasing FM Server Database Cache from 2GB to 8GB but it only made it worse or had no effect. Never had these issues with FMS11. We did not rebuild all of our layouts with new themes(there are many hundreds of them). Our Server is 8-core Xeon 3.33Ghz 32GB RAM and 128GB SSD RAID Fibre Channel. This performance issue is killing us. We’ve been trying to make database changes to enhance performance where we can but nothing seems to help. Do you think rebuilding the most widely used layouts using FM13 themes will help until we can increase our server cores? Thanks for any advice you may have.
Hi Dave
Your core issue is that the load on the server of all your classic layouts will be high, as every layout object is being individually uploaded to the client on every layout, i.e. all local styles – which is very inefficient hence the load.
I have no doubt that rebuilding your layouts using a theme will help.
There may be other issues as well but the initial focus should be on the layouts as you have clearly already sort of identified.
In order to quantify your server performance you could try running some standard tests and then have a look at the pinch points.
I will talk with you direct and we can see what we can do to improve matters.
Cheers, Nick
I believe we are seeing this FileMaker choking happen on our FM Server. It’s very odd too me. We have a 2 server set up with WD on it’s own server. Both servers are Mac Minis with a 4 core cpu and 16gb of memory. When the choke happens, I think it happens on the FM DB side and not the WD side, although I’ve seen the WD server spike up in CPU as well. For what ever reason, when this choke happens, it will take several minutes to log in through WD, but once you are logged in, you can access the database pretty quickly. We do not see any slowness if we log in through FileMaker Pro client. We also do not see any slowness if we log in through WD on a different database. My question is, how does FM and WD utilize the CPU and threads?
When the choke happens, it only seems to affect 2 cores on our CPU. See here: https://imgur.com/nYZhRx5
I tried to scale it best I could. We see a large spike in wait time, and then CPU spikes to around 30%. Then we see a large spike in remote calls per second. Then, for no apparent reason, the cpu will drop down back to around 0%.
We have no problem purchasing new hardware, but we want to be sure that the added cores will fix the issue. I am concerned why FileMaker is choking on only 2 cores and leaving the other 2 cores available.
Thanks!