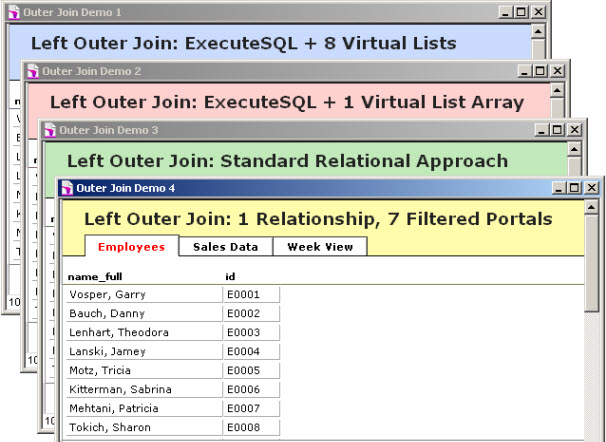
Recently I had an on-screen reporting challenge, and decided to try several different approaches to see which would be fastest. The challenge: Starting with two tables, one containing 20 Employees, and one containing 2,000 Sales records for the current year…
…display daily sales totals per employee in a seven-day grid, like so:
 Of course, as many new FileMaker developers discover to their dismay, FileMaker reports don’t naturally work this way. A standard FileMaker report summarizes values in the child table (Sales) and might look something like this:
But one problem with basing a report on a child table is that you can’t include parents that aren’t there. So what happens when you want to show all employees on a weekly sales report, even the ones that didn’t make any sales that particular week? There are various ways this can be accomplished, and today we’re going to explore four of them…
Update 17 April 2013: Demo 2 contains a flawed SQL statement, and is rendered obsolete by the demos in part 2 and part 3, but the overall approach delineated here is worth reading I think.
- Outer Join Demo 1
Outer Join Demo 2- Outer Join Demo 3
- Outer Join Demo 4
The issue, in a nutshell, is that we need to show all values from table A, whether or not there are any matching values in table B. This is known as an “outer join”, or more precisely a “left outer join”, since we want to see all values in the “left” table (Employees), whether or not they have corresponding matches in the “right” table (Sales).
Incidentally, the Coding Horror blog has a wonderful visual explanation of various types of joins, including Left Outer Joins:
And now might be a good time to point out that FileMaker’s internal SQL parser uses the term LEFT JOIN instead of “Left Outer Join”.
So, common sense would suggest that this type of report should be based on the parent table (Employees) rather than the child table (Sales), and indeed I did go that route in demos 3 & 4. But intially I decided to create a separate “viewer” table, using Bruce Robertson’s Virtual List technique in conjunction with ExecuteSQL. If you need a refresher on Virtual List, I included an explanation here, and Mighty Data did a two-part series on it here and here.
And if you need a refresher on ExecuteSQL…
- FM 12 ExecuteSQL, part 1
- FM 12 ExecuteSQL, part 2
- FM 12 ExecuteSQL: Dynamic Parameters, part 1
- FM 12 ExecuteSQL: Dynamic Parameters, part 2
- FM 12 ExecuteSQL: Robust Coding, part 1
- FM 12 ExecuteSQL: Robust Coding, part 2
Demo 1: ExecuteSQL + 8 Virtual Lists
The plan: Create eight virtual lists. The first list represents Employees, sorted by full name (last, first) and will have no empty rows. The other seven columns represent total sales per employee on successive dates, and will very likely have some empty rows, since not every employee will generate sales every day. Here are the first three columns (cols 2 and 3 show sales for October 1st and 2nd):
And here’s how they appear in the week view… with the week view’s ID field temporarily revealed as a reminder that the ID corresponds to the row position in each $$column_x variable. ID is a simple auto-entered serial number, and using it is both faster and more flexible than using Get(RecordNumber).
Here are the tables…
…and here are field defs for the week view:
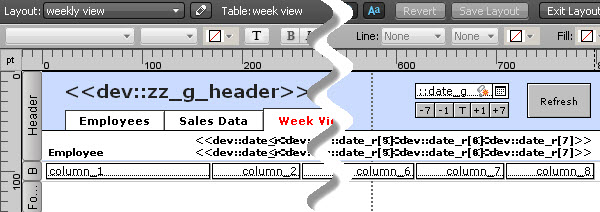
Here’s the week view in layout mode:
The date labels for the seven days are calculated thus:
And here’s the script to update the viewer.
To recap: $$column_1 is simply a sorted list of all employees. The remaining columns (2-8) correspond to dates 1 – 7, i.e., the repetitions of dev::date_r, and of course a given employee may generate multiple sales per date. So let’s take a look at how $$column_2 is populated (in the interest of readability I have ignored robust coding practices).
Finally, let’s click the Refresh button (or any of the other buttons) on the viewer and see what happens.
Hmm… a little sluggish isn’t it? Originally, I had 4,000 sales records in demos 1 and 2, and then it was more than just a little sluggish, so I removed half of them. (You can run the “create sales entries” script in any of the four demos if you’d like to add more records to the Sales table.)
Demo 2: ExecuteSQL + 1 Virtual List Array
Reminder: this method is discredited because my ExecuteSQL statement did not yield correct results. But it did lead to the successes described in part 2 and part 3.
The plan: Since eight virtual lists (and seven left outer joins) weren’t blazingly fast, instead use a single ExecuteSQL statement to populate a 2-dimensional array. There will still be seven outer joins, but perhaps combining them in a single complex statement will have a performance advantage over performing seven simple statements sequentially.
Except for color, Demo 2 doesn’t look any different in browse mode…
…or in layout mode for that matter.
All the heavy lifting is done by the highlighted line in the “update week view” script…
Here it is in detail. Note that I had to use separate aliases for columns 2-8, i.e., s1, s2, etc., and that I specified a bullet character as the column delimiter (and accepted the default hard return as the row delimiter).
The resulting array looks like this:
All of the “column” fields are defined to parse the array using a custom function, GetArrayItem…
…and here’s the definition of the custom function:
So, with high hopes and a brave smile, I click one of these buttons… and… and…
…it’s not faster than Demo 1. Unfortunately, it’s a bit slower. Oh well, at least I had an opportunity to spend some time with left outer joins. Of course it’s possible that you, dear reader, know some FileMaker SQL voodoo to speed things up, and would be willing to share? If so, I encourage you to post a comment below.
Demo 3: Standard Relational Approach
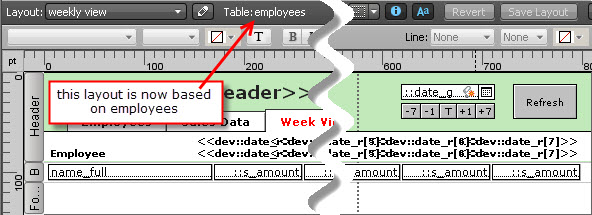
The plan: solve this problem “on the graph” by leveraging the standard FileMaker relational model. Get rid of the week view table, and base the week view layout on the Employees table. Also, on a hunch this approach is going to be faster, add another 8,000 records to the Sales table, to bring the total to 10,000 records.
Here are the tables…
Next, add some calculated date fields to the employees table… these will serve as relational predicates.
Throw some new TOs (s1 through s7) onto the graph:
Define a summary field in Sales:
Configure the week view layout like so…
…with each instantiation of s_amount coming from the proper table occurrence.
Now what happens in browse mode when we click a button? It gives the speed of light a run for its money, that’s what!
Update 27 May 2013: My definition of “light speed” has been upgraded [insert obligatory joke about it being “relative”]… see Fast Grid Displays on a WAN.
Demo 4: One Relationship, Seven Filtered Portals
At this point I figured I wasn’t going to be able to improve on “the speed of light” but out of curiosity, and with Bev Voth’s recent article Aggregates (Summary Fields) in Filtered Portals fresh in mind, I wanted to see what would happen if I moved the date filtering logic out of the graph and into the interface layer.
The plan: use invisible, one-row-high filtered portals.
Step 1: Strip the graph down to this:
Step 2: Repoint all the s_amount fields to the “sales” table occurrence:
Step 3: Overlay each with an invisible portal, with the filtering criteria set accordingly, e.g.,
And here’s how it looks in browse mode.
The verdict: it ends up being slower than Demo 3, but clearly faster than Demos 1 and 2 (bear in mind that Demos 1 and 2 contain only 1/5th as many Sales records).
Can we do anything to remedy the unsightly gaps? What if we a) shrink the invisible portals by a couple pixels both horizontally and vertically, and b) draw lines below and to the right of them to mimic the missing field borders?
Yes, that appears to do the trick.


Great comparison. And also a good reminder to always prototype various scenario for each given situation (e.g. local/lan/wan or desktop/iPad).
Thanks Rob. And great point about the various scenarios. Prototyping is essential.
Very clear explanation. Well done. Thanks
Your kind words are much appreciated Philip.
Thank you Kevin! – I love reading your articles!
Your results comparing ExecuteSQL to relational finds are somewhat astonishing. Showing the list with traditional relational filters means FileMaker need to perform all those relational finds and it does it even quicker than SQL aggregates the data?!
.
The good thing is that this also works for FM11. Not all customers have taken the leap over to .fmp12.
There is one more scenario that you have not mentioned here. In demo 1 and 2 you use SQL to perform the Find and to populate the variables for the virtual lists. What about letting FileMaker perform all these Finds in loops, setting one, two or eight variables with data from employees and the corresponding sums of sales from the Sales table?
Using one or two variables would mean populations repetitions to show the data.
The scripting for this method is more heavy, with one inner loop setting the sum values for each week day and the second outer loop going to the next employee in the list.
This method will also show all employees, even with no sales for the specified week.
– Since all finds for sales sums are performed without shifting layout and table, the series of Finds are performed quickly.
I will make a test for this method, compare the results and get back to you.
– Have you tried Perform Find’s in loops for something like this?
Kind regards, Arild
Hi Arild,
Thank you for such a detailed comment. There were any number of other methods I could have tried, including the one you suggest. I discussed a similar approach in my “Fast Summaries” and “Array Charting” postings 15 months ago.
Regards,
Kevin
Arild, sorry I didn’t follow up on your suggestion sooner. It’s one thing to have a technique in your tool kit, and another to remember to use it. See Fast Grid Displays on a WAN.
Is there a easy way to add a total amount of sale by all employees on each day at the bottom of the report using the traditional relational filter method?
I created a couple variants on demo 3 for you. If you always want to see totals for all employees (in other words, daily summaries), then demo 3a will do what you want. If on the other hand you’d want the summaries to reflect the current found set of employees, then check out
demo 3b[superceded by demos 3c and 3d below].Hi Kevin,
Thank you for sparing the time to answer my question and create the demo 3a and 3b. Demo 3a uses built-in relationships to do the calculation of totals. It works perfectly.
There is a problem with Demo 3b. The formulae of the calculation fields and summary fields would not get evaluated when the -7, -1, T, +1, +7 buttons are clicked. Thus the totals displayed at the bottom remain unchanged, unless the user switches to Sales Data tab and click back to Week View tab. (Switch to Employee tab will not get the totals updated. Both tab “Show records from employees” table occurrence.)
The problems with Demo 3b were exactly what I encountered before I post my question. Is there anyway to force the calculation fields and summary fields of a table to be evaluated by script steps? It seems to me that Go to Layout and then back to original layout, or Refresh Window would not do the trick. Do I miss anything?
You’re absolutely right. Here are two replacements for demo 3b: Demo 3c and Demo 3d. The former adds a little “wakeup” tickle to the total calcs; the latter does the same but replaces individual fields with repeaters where possible.
They work great, simple and elegant. Thank you.
Make sure to check out Fast Grid Displays on a WAN — it does this much more quickly… and yes, it includes the summary.