Chart, Level: Advanced, Version: FM 13 or later, Virtual List

FM 13: Virtual List Charts, part 2

Picking up where we left off in part 1, today we’re going to take a look at examples 2 through 6 in the Virtual List Charts demo file (the demo has been updated since part 1, so I recommend downloading a fresh copy).

5-16-2014 4-08-08 PM

We covered example 1 and most of the general concepts last time, so today we’re mainly going to touch on specific points of interest, but to briefly recap… Continue reading “FM 13: Virtual List Charts, part 2”

Chart, Level: Advanced, Version: FM 13 or later, Virtual List

FM 13: Virtual List Charts, part 1

4-20-2014 11-18-24 AMToday we’re going to look at applying the virtual list technique to FileMaker charting with the goal of producing a reusable chart “object”, or rather, a series of chart objects. We’ll need more than one because while certain attributes (e.g., chart title) can be set programmatically, others, including type (e.g., column or line), must be hard-coded into the chart object.

We’ve already explored Bruce Robertson’s virtual list on this site a number of times, but briefly, you create a utility table in your solution to facilitate non-standard viewing, reporting, etc., and pre-populate it with “more records than you’ll ever need”. The records in this table will derive their data “virtually”, by parsing it from an array — typically one or more $$variables.

Well it turns out the technique can be applied to charting as well, and today we have a demo file, Virtual List Charts, that contains six examples: three for Web Visits…

4-20-2014 2-03-32 PM

Continue reading “FM 13: Virtual List Charts, part 1”

Chart, ExecuteSQL, Level: Advanced, Version: FM 12 or later

Weekly Sales Comparison Charts

If you are responsible for helping business decision makers analyze data, you are probably familiar with questions like:

  • Are we on track to meet or exceed last year’s sales totals?
  • How is our sales team doing now, compared to this time a year or two ago?

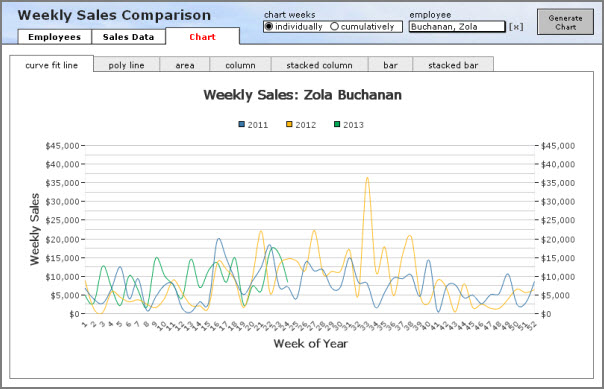
Today’s demo file, weekly sales comparison charts, v3, can help answer these questions. It consists of an Employee table with 20 records, a Sales table with approximately 40,000 records, seven chart types, and an option to chart weekly amounts either individually or cumulatively.

6-23-2013 11-46-18 PM

When we look at the weeks individually, it’s clear that Zola Buchanan’s sales figures are mixed so far this year, compared to 2011 and 2012. But what may not be immediately apparent is whether overall she’s doing better, the same, or worse.

Continue reading “Weekly Sales Comparison Charts”

Chart, Level: Intermediate, Version: FM 11 or later

Array Charting, part 3

[This article assumes that the reader is familiar with part 1 and part 2 of this series.]

The other day, I ended part 2 of this series by looking at the y-axes of a variable-array-based chart, and commenting, “Note that all 52 variables for each of the 12 data series are individually enumerated. I’m thinking that there is a smarter way to go about this, but that is code for another day.”

Well, now I’m thinking that “another day” has arrived.

Continue reading “Array Charting, part 3”

Chart, Level: Beginner, Version: FM 11 or later

A Charting Tip from the Old Advance Man

Here’s a tip I picked up from Steven Blackwell the other night on Friday Night FileMaker Chat. FileMaker 11 doesn’t provide an obvious way to prevent a user from interacting with a chart in browse mode (e.g., copying, clicking on, dragging, or mousing over to view tooltips).

Continue reading “A Charting Tip from the Old Advance Man”

Chart, Level: Advanced, Version: FM 11 or later

Array Charting, part 2

Last week we looked at building a FileMaker 11 native chart based on data that has been parsed into a field-based array.

2011-07-11-b

I happen to like field-based arrays, for reasons I’ll get to in a minute, but is a field-based array really necessary to generate the above chart? Continue reading “Array Charting, part 2”

Chart, Level: Intermediate, Version: FM 11 or later

Array Charting, part 1

In recent postings we’ve looked at…

While these three techniques may not appear to have much in common, all of them are used as building blocks in today’s demo, line-chart-from-field-array. Our data set is a table of web site visits, by week and by state, beginning in March 2006 and running through June 2011.

Wouldn’t it be nice to to use FileMaker 11’s built-in charting capabilities to produce a line chart showing weekly visits per year? Continue reading “Array Charting, part 1”