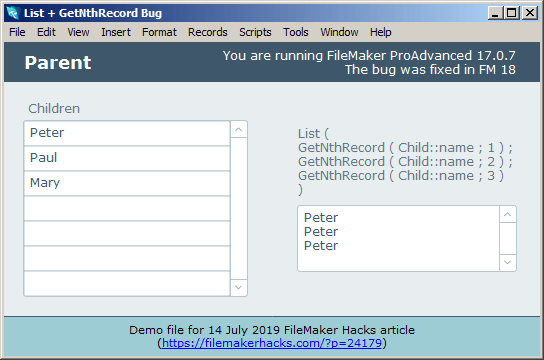
Recently I was working in FM 17 and ran into an unexpected bug. My use case was more complex than this, but the following bare bones demo illustrates the problem.
Demo file: List+GetNthRecordBug.zip
Recently I was working in FM 17 and ran into an unexpected bug. My use case was more complex than this, but the following bare bones demo illustrates the problem.
Demo file: List+GetNthRecordBug.zip
If you are responsible for helping business decision makers analyze data, you are probably familiar with questions like:
Today’s demo file, weekly sales comparison charts, v3, can help answer these questions. It consists of an Employee table with 20 records, a Sales table with approximately 40,000 records, seven chart types, and an option to chart weekly amounts either individually or cumulatively.

When we look at the weeks individually, it’s clear that Zola Buchanan’s sales figures are mixed so far this year, compared to 2011 and 2012. But what may not be immediately apparent is whether overall she’s doing better, the same, or worse.
[This article assumes that the reader is familiar with part 1 and part 2 of this series.]
The other day, I ended part 2 of this series by looking at the y-axes of a variable-array-based chart, and commenting, “Note that all 52 variables for each of the 12 data series are individually enumerated. I’m thinking that there is a smarter way to go about this, but that is code for another day.”

Well, now I’m thinking that “another day” has arrived.